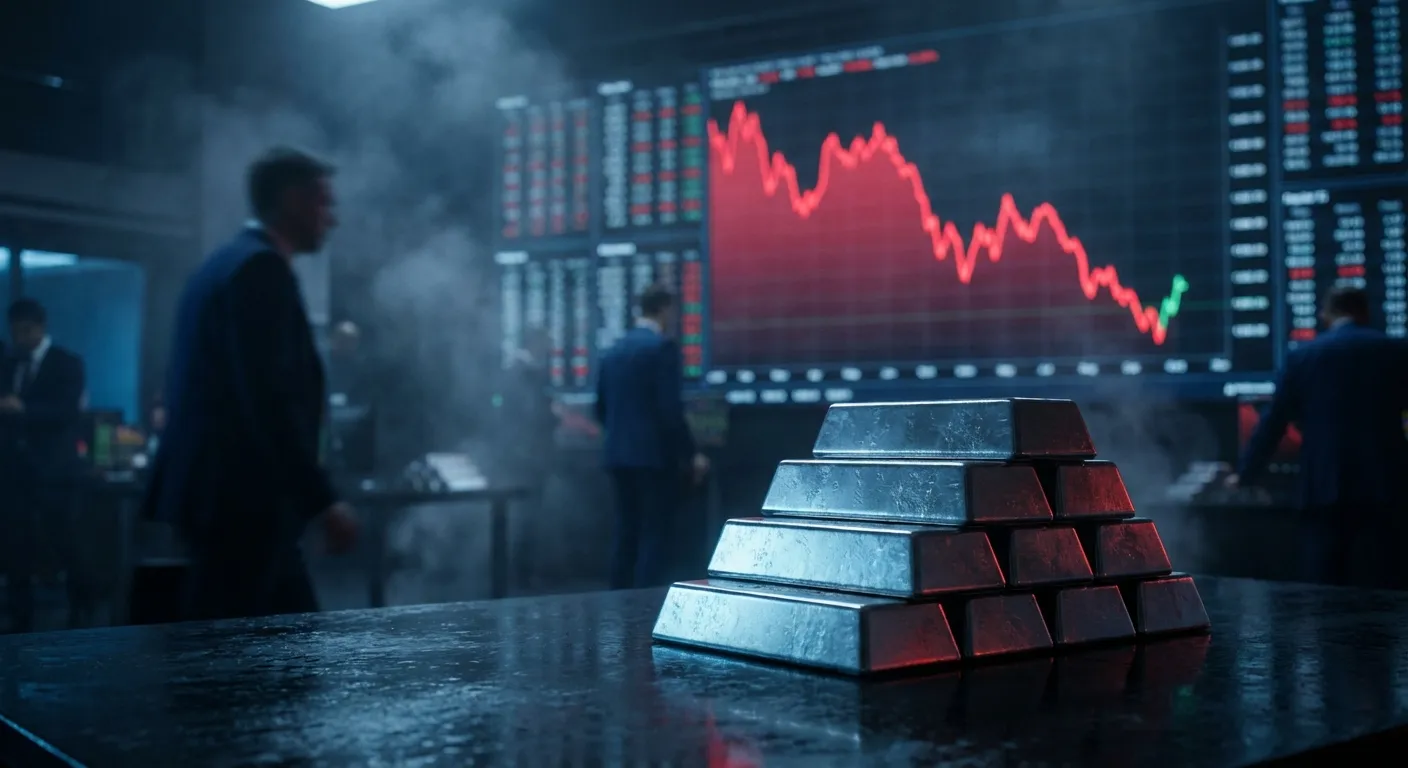
Silver is down 21% in the last 24 hours. It has now broken below last Friday's crash low. After surging to an all-time high of $121 per ounce on January 29, the metal has plunged to the mid-$60s as of today, February 5, 2026.
For anyone watching the charts, this feels catastrophic. But for anyone who remembers March 2020, this feels strangely familiar.
"When markets get chaotic and dysfunctional, the most vulnerable and most leveraged get taken out and killed first. This is somewhat analogous to the very early days of the pandemic."
What Happened
Silver rallied 73% in four weeks to hit $121 on January 29. Then on January 30, it suffered its worst single-day crash since 1980 — plunging over 30%. After a brief bounce to ~$85, it continued bleeding lower. Today it sits near $67, down 45% from the peak.
Why: Leverage, Not Fundamentals
This isn't about silver's value. It's about market mechanics. When chaos hits, the most leveraged positions get killed first — margin calls trigger forced selling, which triggers more margin calls, creating a waterfall that has nothing to do with the asset's real worth.
Silver's derivatives market is massive relative to its physical market. When leveraged bets unwind, price moves get amplified far beyond what supply and demand would dictate. Traders aren't selling because silver changed — they're selling because they have to.
The COVID 2020 Playbook
This exact dynamic played out in March 2020. The hardest-hit markets weren't the ones tied to the pandemic — they were the most leveraged:
- Silver: Crashed ~40% from $18.50 to $12.12
- Oil: Collapsed from $60 to negative $37
- Copper: Dropped 25%+ on leveraged unwinds
All liquidity-driven crashes. Nothing to do with long-term value.
What Happened Next
This is the part that matters.
Silver: $12.12 → $29.78 in five months — a 146% gain. Oil recovered from negative to $60+ within a year. The assets that crash first and hardest in a liquidity event are often the ones that recover first and strongest.
By February 2021, silver topped $30 for the first time since 2013. The fundamentals hadn't changed — the leveraged positions just needed to clear out first.
Why It Could Repeat
Silver's fundamentals haven't changed this week:
- Five years of supply deficit — cumulative shortfall of ~820 million ounces since 2021
- Record industrial demand — solar, EVs, semiconductors, AI consuming more silver than ever (now classified as a U.S. critical mineral)
- Supply can't keep up — 1.01 billion oz produced vs 1.24 billion oz demanded in 2025
None of that vanished because leveraged traders got margin called. The supply deficit is still there. Solar production didn't stop. What changed is that overleveraged positions were violently unwound — just like March 2020.
Every major silver bull market in history has included at least one gut-wrenching correction that felt like the end. In most cases, it was the beginning of the next move higher. Whether this time follows the same playbook remains to be seen — but the script looks remarkably familiar. For more context, see our analysis of the 50-year rarity of this crash and the buying opportunity it presents.
Disclaimer: This article is for informational purposes only and does not constitute financial advice. Past performance does not guarantee future results.
Interested in Physical Silver?
MSS Gold offers 999.9 Pure Silver KG Bars with competitive pricing and secure delivery across Bahrain. No leverage, no counterparty risk — just real metal.
Contact Us on WhatsApp